For your own safety, take an Avalanche Safety Course.

Making a "risk assessment" as to the likelyhood of avalanches occuring is part of Avalanche Safety Training. Even highly qualified and experienced avalanche experts have a hard time making this determination. Traditional methods involving analysis of snow conditions are generally time consuming and subject to individual interpretation. When you can perform the same tests within yards of each other and come up with different "answers", it is clear that avalanche risk assessment is somewhat of an "art", not a "science".
Weather patterns and recent weather history are used by various agencies and organizations to identify periods when avalanche hazard is high in an area. It is up to the backcountry visitor, however, to evaluate the specific avalanche danger in the area they are visiting.
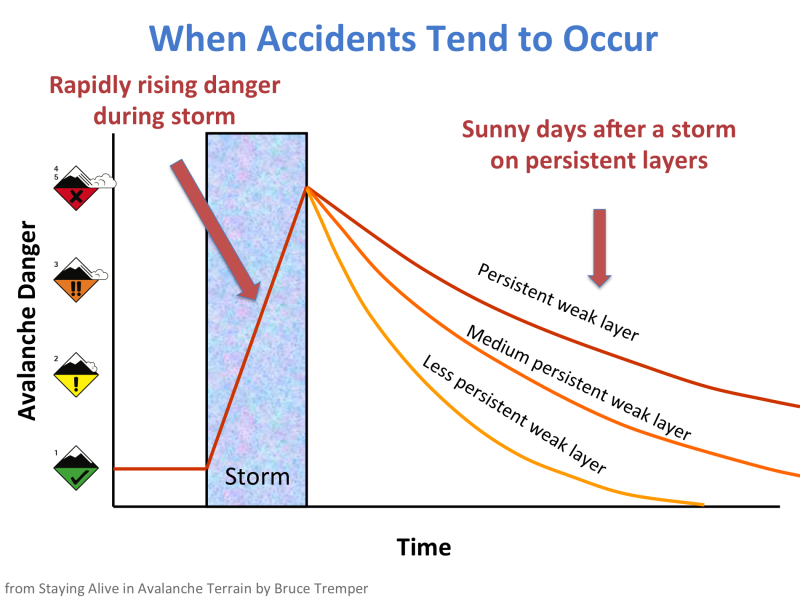
The paperback book Staying Alive in Avalanche Terrain, 2nd Edition 2008 by Bruce Tremper, published by Mountaineers Books and available from them and from Amazon is highly recommended reading.
Risk Assessment Tools
Tools for assessing avalanche risk fall into two categories: 1) Scientific Methods utilized primarily by professional avalanche forecasters; 1) Observational Methods utilized primarily by the general public. Extensive information is available on the Internet by searching "Avalanche Risk Assessment".
This document: Avalanche Danger - How to better assess the risks (PDF) in English from the Swiss Council for Accident Prevention provides guidance for assessing avalanche risk.
Scientific Methods
There is excellent information on the U.S. Forest Service National Avalanche Center and the Gallatin National Forest Avalanche Center websites:
Observational Methods
These methods are primarily intended for use by backcountry travelers with limited or no training in the scientific methods. They also do not take the time required for the scientific methods and can be easily and quickly used during a trip to evaluate each area/slope as they progress during a trip. Users can include novice/beginner through expert with their level of knowledge determining how they use these tools. Following information adapted from Utah Avalanche Center and SnowBrains websites.
For many years a variety of observational methods were developed in Europe. These European methods did not apply well to conditions in the United States and Canada. After much study and analysis, in 2010/2011, United States and Canadian avalanche experts implemented the North American Public Avalanche Danger Scale specifically aligned to United States and Canadian circumstances. This document North American Public Avalanche Danger Scale (PDF) provides details.


Click HERE for a pdf of this scale
This video explains the North America Public Avalanche Danger Scale - TURN UP YOUR VOLUME
|
|
|
|
|
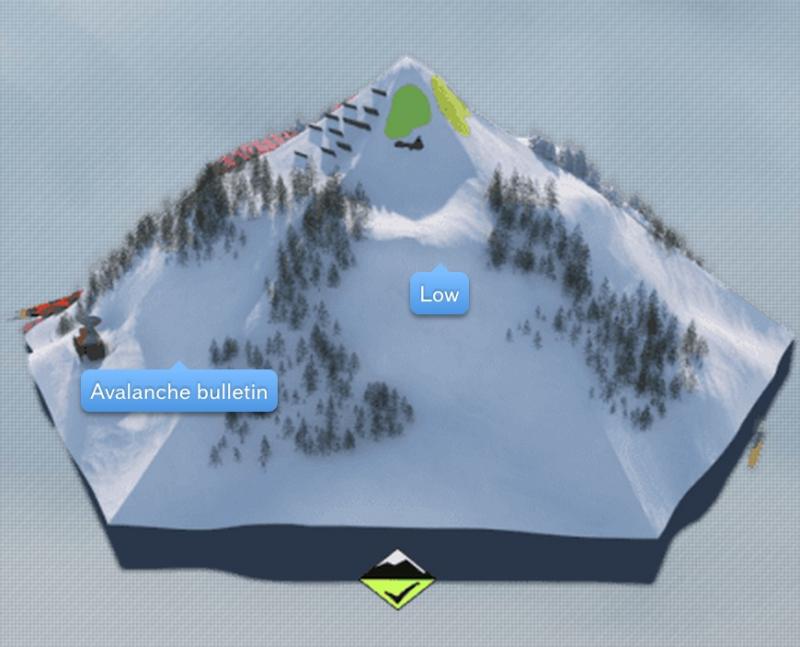
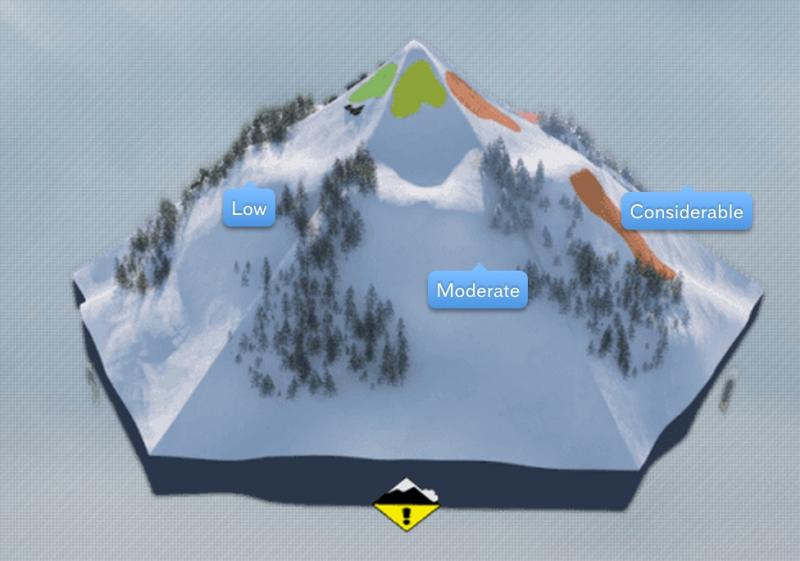
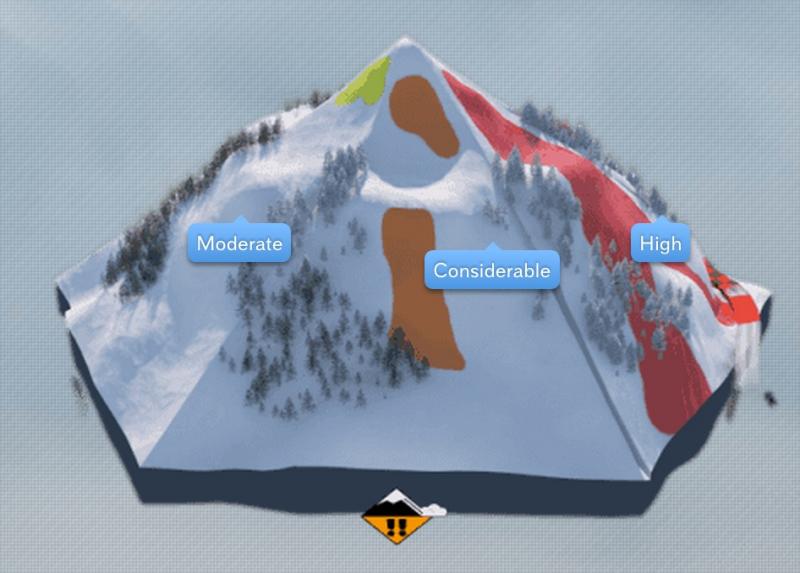
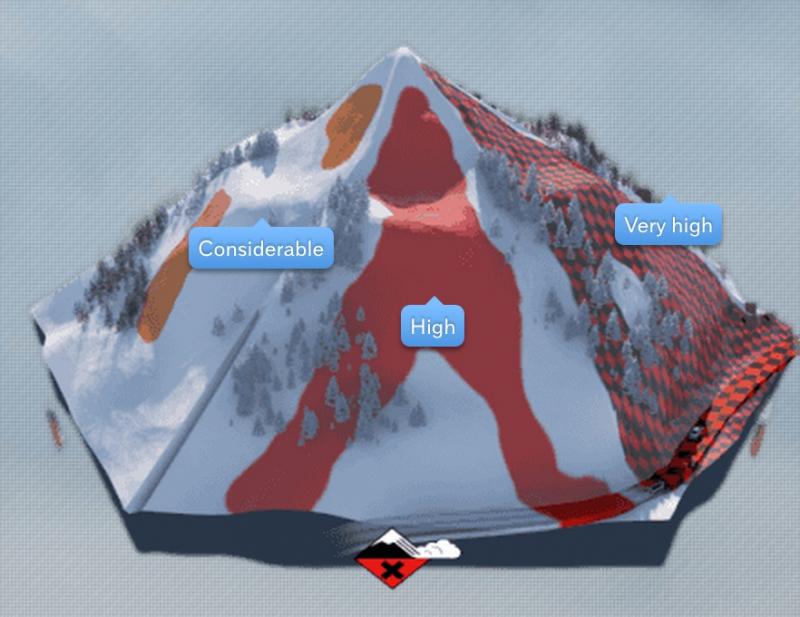
| Low | Moderate | Considerable | High | Extreme |
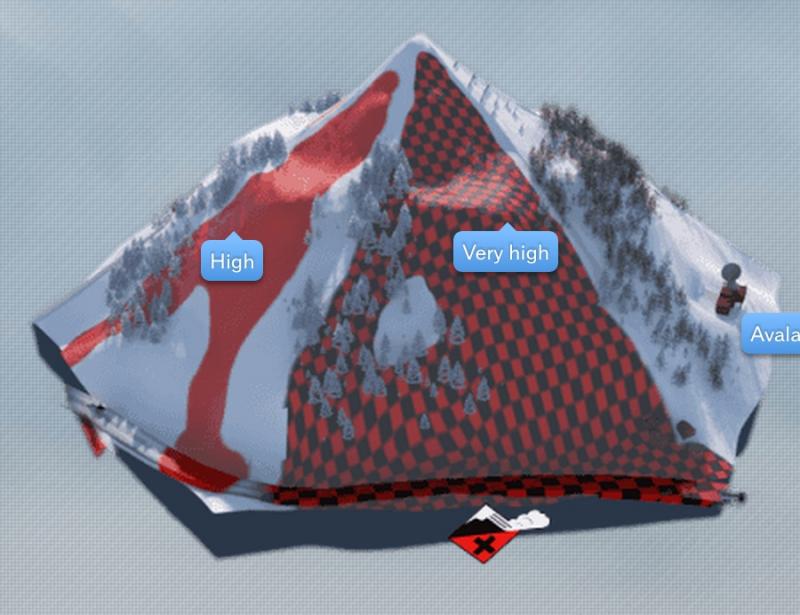
These images from the Swiss website White Risk, show typical size and distribution of avalanches during the various danger ratings.
You must remember Four important points about this scale:
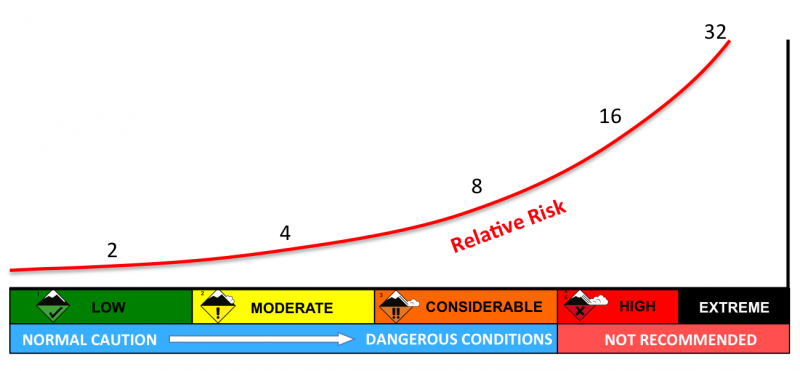
1) The scale is not linear. Your risk increases about two fold for each rising level on the danger scale. In other words, you take on twice as much risk at Moderate as Low and you take on four times more risk going from Low to Considerable. And so on. The risk numbers in the graph below come from Werner Munter's estimates based on avalanche acitivity in Switzerland.
2) Most avalanche fatalities occur at Considerable danger because the maximum interaction between people and avalanches occurs there. There is also more uncertainty associated with Considerable danger and the difference between dangerous and not-so-dangerous terrain is much harder to identify.
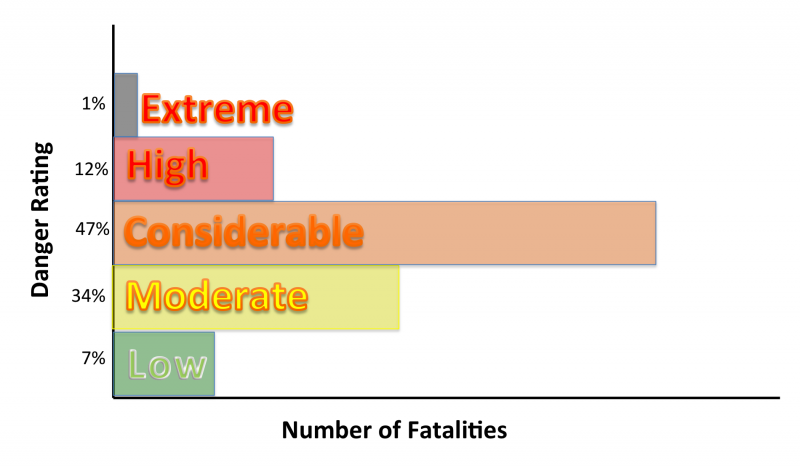
Most people go into avalanche terrain in the middle danger ratings. Thus, avalanche fatalities tend to occur when there is a maximum interaction between avalanches and people.
3) The avalanche danger ratings are for "avalanche terrain" meaning for slopes steep enough to slide, in other words, slopes generally steeper than 30 degrees. But since 3 out of 4 avalanches occur on slopes between 34 and 45 degrees, the danger ratings are mainly for these slope angles. Even on High Danger days, you can always find safe terrain on low angled slopes not locally connected to steeper slopes.

4) The danger ratings are based on BOTH probability and consequences. In times past, the danger ratings were based on just probability of triggering an avalanche but with the new danger ratings that came out in 2010, they are based on Likelihood of Triggering (probability) versus Size (consequences). This was adopted to conform to standard risk theory and also as a better way to communicate the character of the hazard, for instance avalanches that are hard to trigger but if you do trigger one, it will be very large and dangerous.
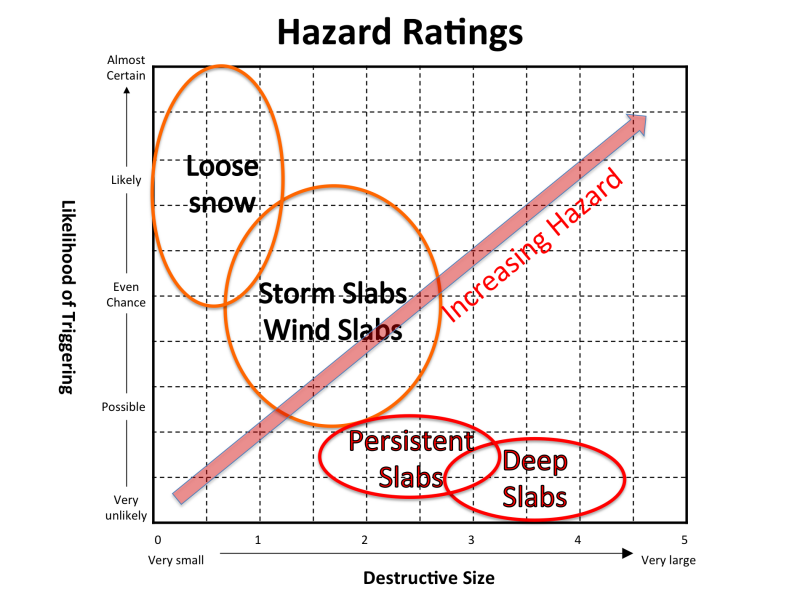
Since avalanche danger depends on BOTH probability and consequences, different avalanche problems with the same danger rating can have very different characteristics. Some are high probability - low consequences. Some are low probability - high consequence. Some are in the middle. The avalanche problems listed here are typical of where we see them on a probability - consequence plot.